What is the Mollier Diagram and why is it Important?
The Mollier diagram, also known as the h-x diagram, is a visual tool used to represent the thermodynamic properties of moist air. The diagram was developed by Richard Mollier in 1923 and is often used in industry for applications such as air handling, refrigeration and heating systems. Our experts at Reinders Industrial can help advise you on the Mollier Diagram.
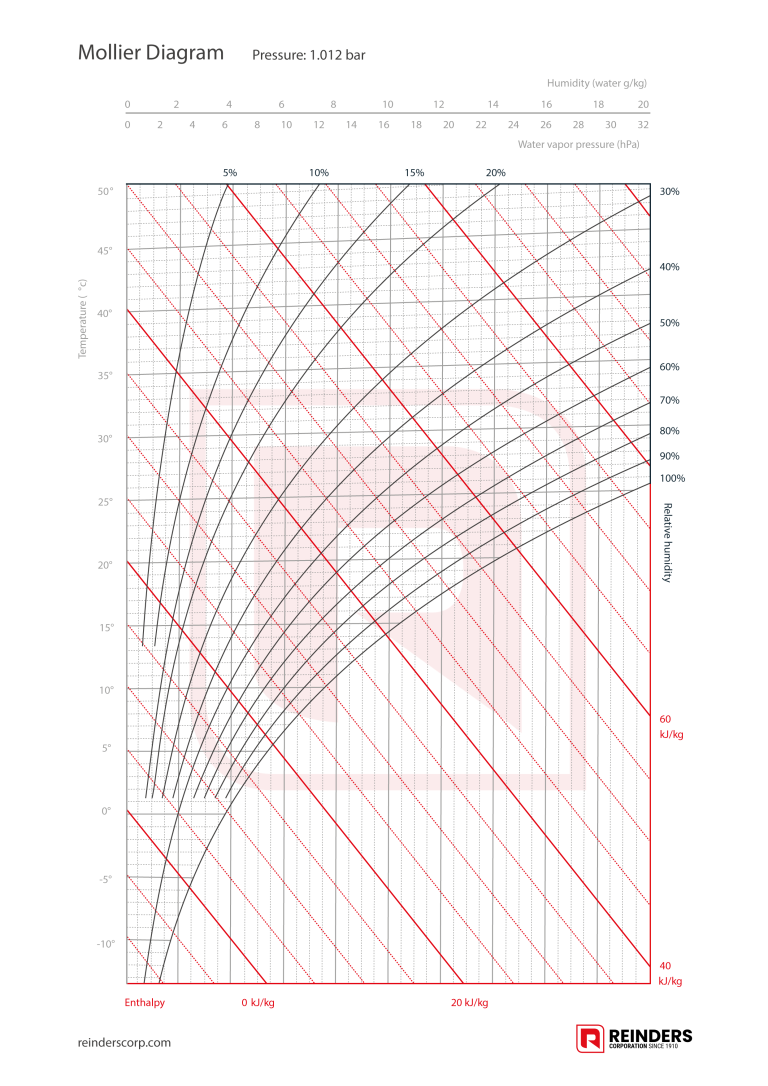
Download Mollier DiagramThe Mollier Diagram consists of:
- The air temperature of the air on the vertical axis.
- The absolute humidity on the horizontal axis.
- The relative humidity indicated by a curve.
- The enthalpy (heat content) with diagonal lines.
Why should you use the Mollier Diagram?
A h-x diagram shows all the crucial parameters needed to describe air conditions, such as: temperature (t) in degrees Celsius, absolute humidity (x) in grams per kilogram, relative humidity (RH) in percent, specific enthalpy (h) in kilojoules per kilogram and density (p) in kilograms per cubic metre.
The Mollier diagram shows the amount of water vapour per kilogram of air at constant pressure, i.e. an atmospheric pressure of 1012 bar. It also shows the dew point and the so-called wet bulb temperature.
The Mollier diagram also allows comparing and optimising the performance of different types of air handling and cooling equipment. Moreover, it can be used to quickly identify and solve problems in a system.
In cooperation with the engineers at Reinders Industrial, we can advise and support you in using the Mollier diagram for your specific applications and for optimising the performance of your air handling and cooling equipment. Contact us for more information.
Difference between h-x- and h-s diagram
- H-x diagrams and H-s diagrams are both thermodynamic diagrams used to represent the thermodynamics of a thermodynamic system.
- H-x diagrams, also known as enthalpy-concentration diagrams, plot the enthalpy of a substance against its composition or concentration. They are used to study thermodynamic processes involving phase changes or chemical reactions.
- H-s diagrams, also known as enthalpy-entropy diagrams, plot the enthalpy of a substance against its entropy. They are used to study the thermodynamic efficiency of processes such as power plants, refrigeration systems, and heat engines.